
English | 简体中文



A fast, interactive web-based viewer for performance profiles (JavaScript, Ruby, Python, Go, native traces and more). Open the app — profiles are processed in your browser. This fork builds on jlfwong/speedscope and adds large-trace improvements, profile transformations and an accessible Call Tree.
Given raw profiling data, speedscope allows you to interactively explore the data to get insight into what's slow in your application, or allocating all the memory, or whatever data is represented in the profiling data.
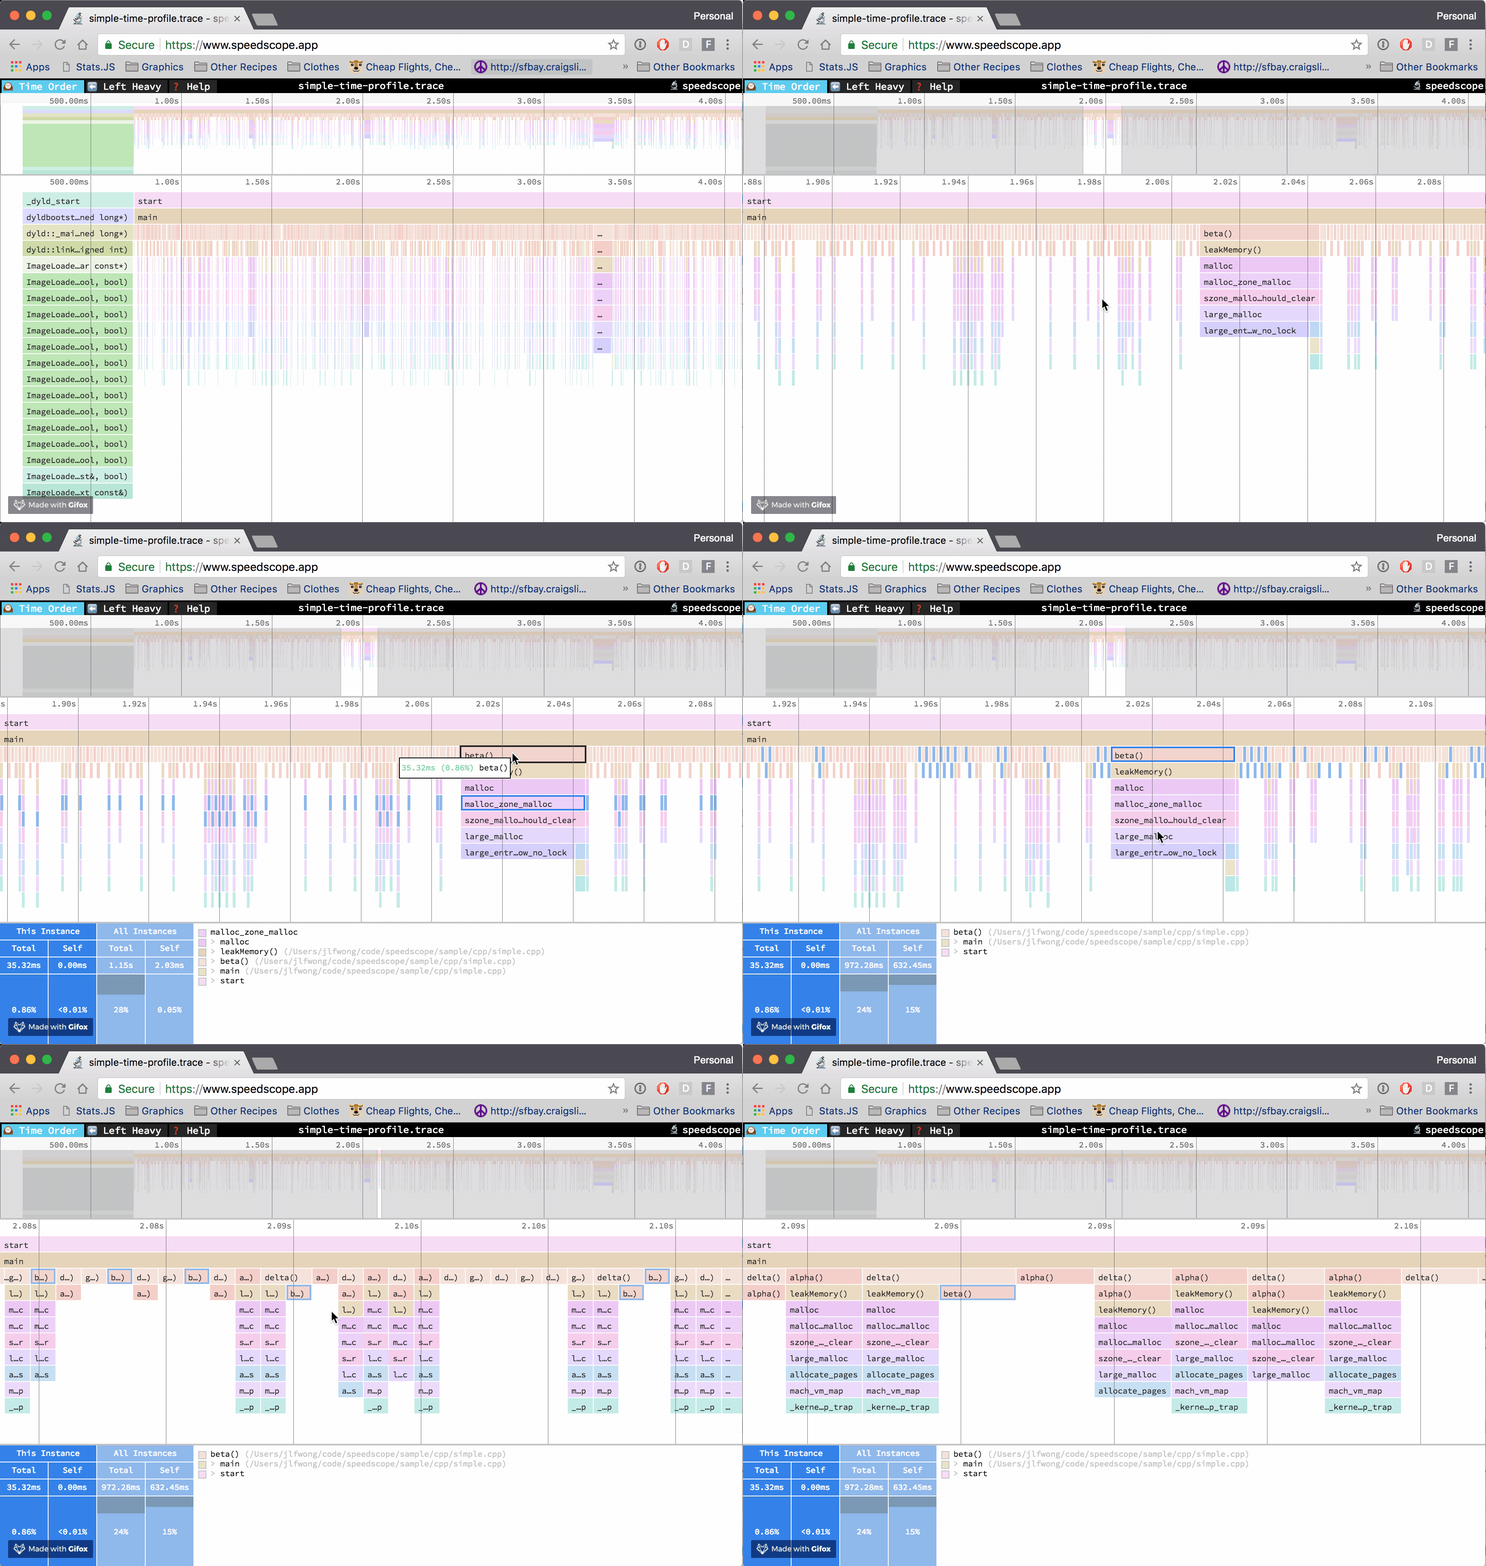
speedscope is designed to ingest profiles from a variety of different profilers for different programming languages & environments. Click the links below for documentation on how to import from a specific source.
- JavaScript
- Importing from Chrome
- Importing from Firefox
- Importing from Safari
- Importing from Node.js
- Importing from Hermes (for React Native)
- JS Self-Profiling: import the JSON returned by
await profiler.stop()from the JS Self-Profiling API.
- Ruby
- Python
- PHP
- Go
- Rust
- Java
- Erlang/Elixir
- Native code
- Importing from Instruments.app (macOS)
- Importing from
perf(linux)
- Importing from .NET Core
- Importing from GHC (Haskell)
- Importing from custom sources
Contributions to add support for additional formats are welcome! Open an issue in this fork. The importer guides above are maintained upstream and remain useful for the supported file formats.
Visit the hosted app, then browse for a profile file or drag it onto the page. Imported profiles stay in your browser.
Large JSON and trace captures import in the background with progress and a Cancel import button. This improves responsiveness; very large captures can still exceed browser memory limits. Search offers Contains, Whole word and Exact matching for function names and source paths. Use Profile actions → Filter frames… to include your code or exclude framework frames by file path or name. It creates a separate aggregate profile and keeps the original available. See filter rules and weight semantics. Duration traces stream plain/gzip input and discard unused events. Oversized captures stop with a clear limit error; see import limits and measurements.
For offline use, or convenience in the terminal, you can also install speedscope via npm:
npm install -g @node-projects/speedscope
The npm package is scoped; the executable remains speedscope. If replacing a
global upstream installation, run npm uninstall -g speedscope first. The CLI
requires Node.js 22 or newer. You can also run it without a global installation:
npx --package @node-projects/speedscope speedscope --serve /path/to/profile
Invoking speedscope /path/to/profile will load speedscope in your default browser.
Use speedscope --serve /path/to/profile to serve speedscope and the profile over
HTTP on an available loopback port. This also works with stdin (speedscope --serve -).
The server stays running until you press Ctrl+C. Profiles remain on your computer.
Without --serve, profile wrappers are kept in separate directories under your
system temporary directory's speedscope folder.
Run npm run serve to start the development server on port 8000. Set
SPEEDSCOPE_PORT to an integer from 1 through 65535 to choose another port.
For example, in PowerShell: $env:SPEEDSCOPE_PORT='8080'; npm run serve.
If you don't have npm or node installed, you can also download a
self-contained version from this fork's GitHub releases.
After you download the zip file from a release, simply unzip it and open the
contained index.html in Chrome or Firefox.
To load a specific profile by URL, you can append a hash fragment like #profileURL=[URL-encoded profile URL]&title=[URL-encoded custom title]. Note that the server hosting the profile must have CORS configured to allow AJAX requests from speedscope.
If the endpoint requires a particular representation, add
&profileAccepts=application%2Fjson to send an Accept: application/json header.
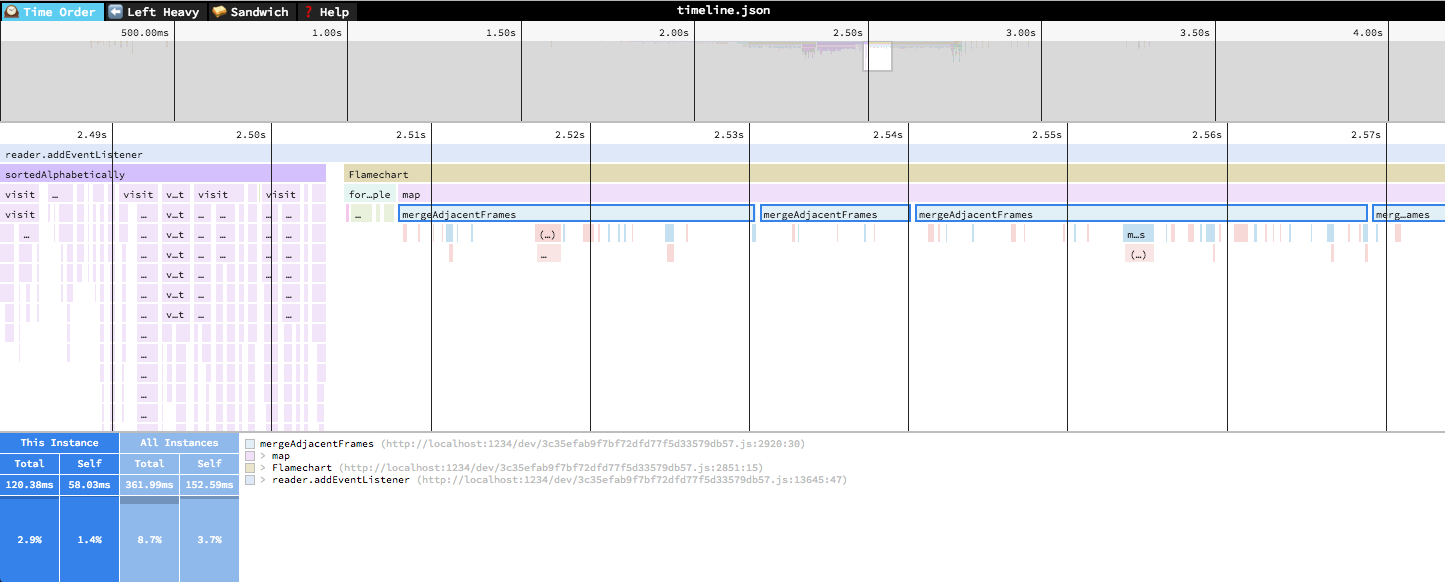
In the "Time Order" view (the default), call stacks are ordered left-to-right in the same order as they occurred in the input file, which is usually going to be the chronological order they were recorded in. This view is most helpful for understanding the behavior of an application over time, e.g. "first the data is fetched from the database, then the data is prepared for serialization, then the data is serialized to JSON".
The horizontal axis represents the "weight" of each stack (most commonly CPU time), and the vertical axis shows you the stack active at the time of the sample. If you click on one of the frames, you'll be able to see summary statistics about it.
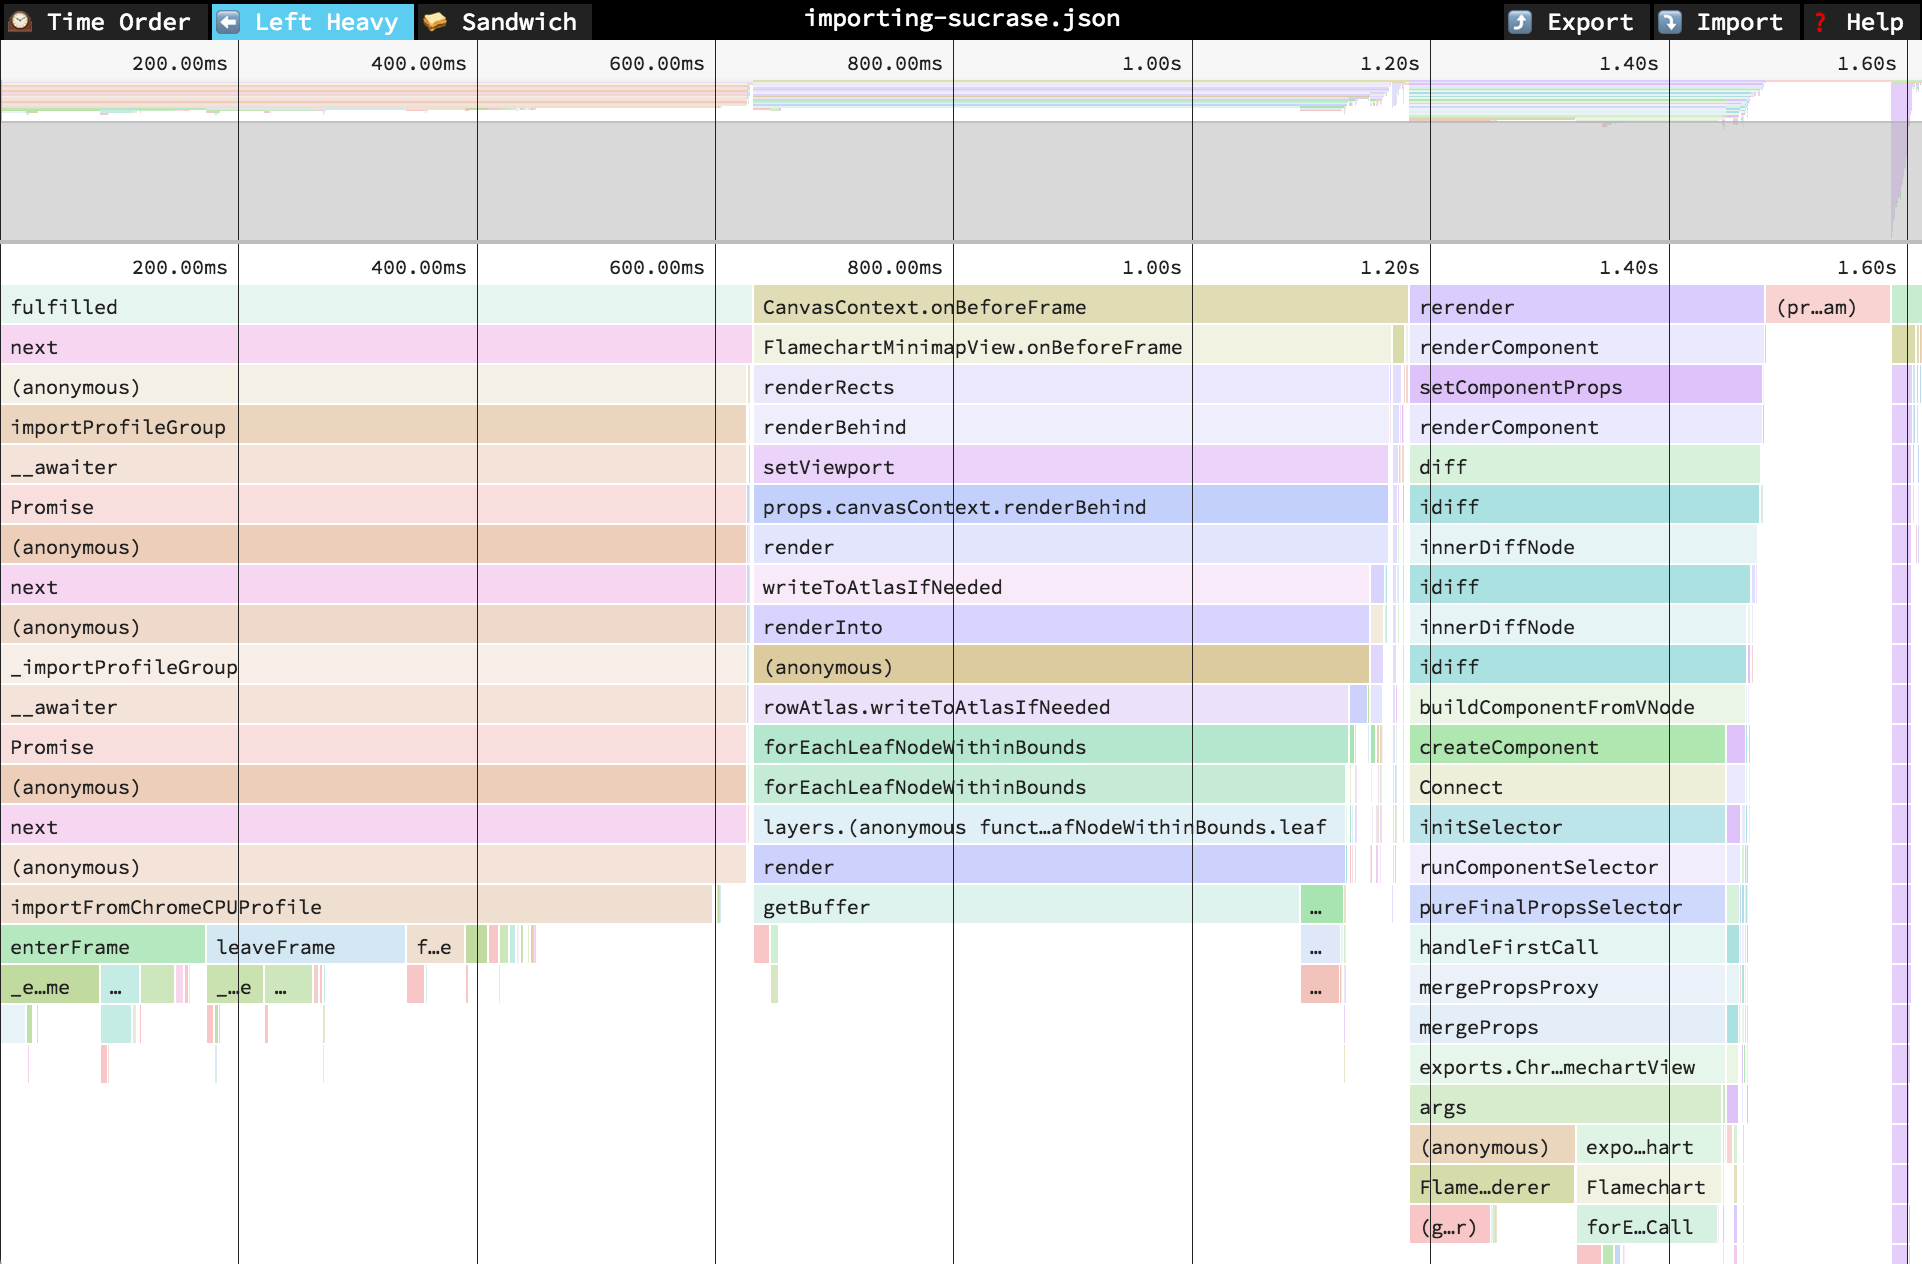
In the "Left Heavy" view, identical stacks are grouped together, regardless of whether they were recorded sequentially. Then, the stacks are sorted so that the heaviest stack for each parent is on the left -- hence "left heavy". This view is useful for understanding where all the time is going in situations where there are hundreds or thousands of function calls interleaved between other call stacks.
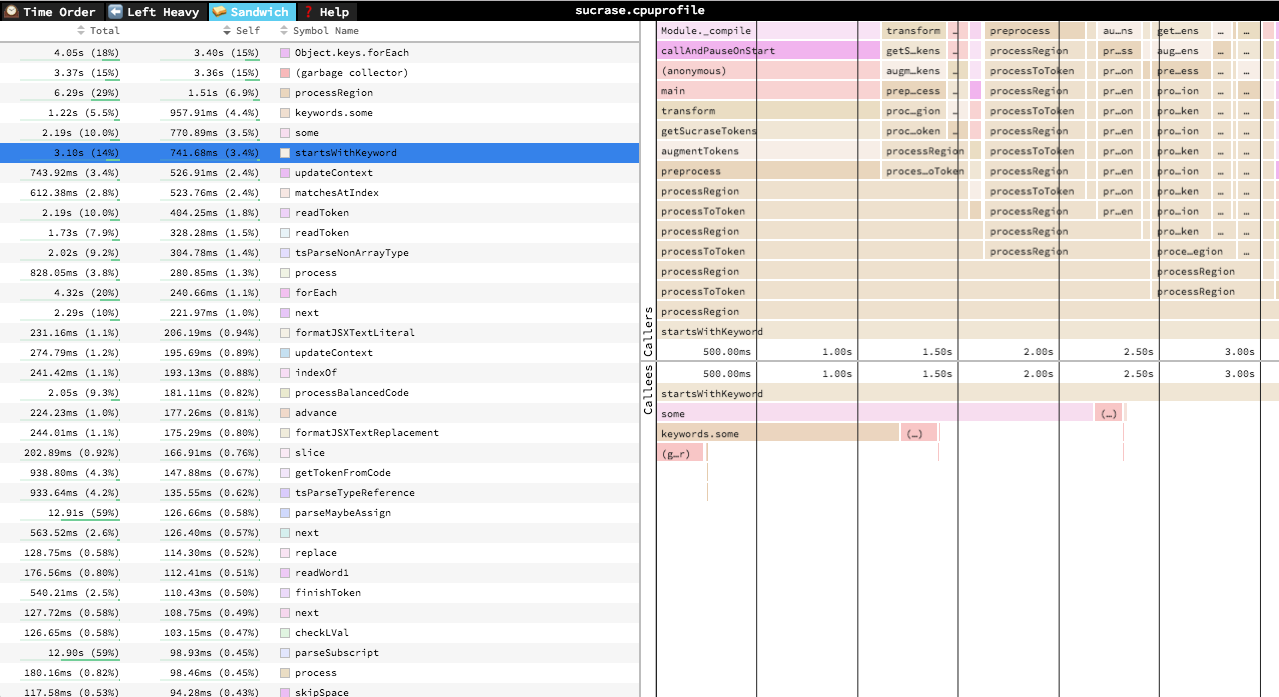
The Sandwich view is a table view in which you can find a list of all functions and their associated times. It's called "Sandwich" view because if you select one of the rows in the table, you can see flamegraphs for all the callers and callees of the selected row. You can sort by total time or self time. Total time is the time spent in a function and all its callees. Self time is the time spent in a function, excluding its callees.
Once a profile has loaded, the main view is split into two: the top area is the "minimap", and the bottom area is the "stack view".
Colors follow the order of frames sorted by file path and symbol name. Frames near each other in that order have similar colors; colors do not indicate cost. Search matches both symbol names and file paths, ignoring case. A file-only match highlights the frame without marking characters in its symbol name.
- Scroll on either axis to pan around
- Click and drag to narrow your view to a specific range
- Scroll on either axis to pan around
- Pinch to zoom
- Hold Cmd+Scroll to zoom
- Double click on a frame to fit the viewport to it
- Click on a frame to view summary statistics about it
+: zoom in-: zoom out0: zoom out to see the entire profilew/a/s/dor arrow keys: pan around the profile1: Switch to the "Time Order" view2: Switch to the "Left Heavy" view3: Switch to the "Sandwich" viewr: Collapse recursion in the flamegraphsCmd+S/Ctrl+Sto save the current profileCmd+O/Ctrl+Oto open a new profilen: Go to next profile/thread if one is availablep: Go to previous profile/thread if one is availablet: Open the profile/thread selector if availableCmd+F/Ctrl+F: to open search. While open,EnterandShift+Entercycle through results
4 opens the keyboard-accessible Call Tree table, with total/self weights,
source locations, expandable callees, and bounded rows for large profiles.
It is also the fallback when WebGL cannot initialize.
The Profile actions menu creates a new profile while preserving the originals: crop the visible Time Order range, combine original profiles with matching units, invert stacks, or group stacks by source file. Combining adds busy-stack weights; it does not align threads on a shared wall-clock timeline. Inversion and file grouping are aggregate views, so inspect them in Left Heavy or Call Tree.
Known aggregate profiles disable Time Order. Aggregate/derived flags survive this fork's exports so combining original captures after reimport does not count derived views again. Export shows progress and a Cancel button while writing JSON chunks. See large-trace measurements and limits for the performance follow-up and benchmark commands.
Run npm run prepack to build an offline viewer and
dist/speedscope-<version>.zip on Windows, macOS, or Linux. Extract the ZIP and open
index.html. This includes the JFR WebAssembly decoder without a network fetch.
The npm package exposes the profile format with
import type {FileFormat} from '@node-projects/speedscope'; internal rendering APIs are not public.
GitHub Actions tests Node.js 22/24 on Windows and Linux. Pushes to main build and
deploy the app to GitHub Pages.
npm run build:pages builds the same site locally in dist/pages with relative
asset URLs for the /speedscope/ project path.
Publishing a GitHub release tagged vX.Y.Z (or X.Y.Z) publishes
@node-projects/speedscope with that version, after tests and packaging. Prerelease
versions or releases marked as prereleases use npm's next tag. Stable releases
use latest. The workflow attaches standalone ZIP and npm tarball downloads to
the release. npm trusted publishing is configured for this workflow; see
release operation and first-publish validation.
Support development via GitHub Sponsors or Patreon. Funding configuration is shared with Web Component Designer.
The maintained issue backlog classifies all reviewed open upstream reports as bugs, features or maintenance, including usefulness, implementation status, remaining work and priorities. We have not fixed every upstream issue; partial and unverified reports stay explicit in that list.
Do you want to contribute to speedscope? Sweeeeet. Check out CONTRIBUTING.md for instructions on setting up your dev environment.